
NetPulse – Real-Time Network Monitor for Windows
See exactly what your machine's network is doing — live download and upload speeds, TCP/UDP/IP/ICMP protocol charts, per-adapter throughput, every connection mapped to the process that owns it, ping / DNS / traceroute probes, saved history, and threshold alerts by email, webhook or Pushover. Works the same on a desktop PC and on Windows Server over Remote Desktop.
Download Desktop Version 2.1.0
Free on the Microsoft Store — no subscription, no ads.

All-new in 2.0 — a complete redesign
NetPulse 2.0 is a ground-up reconstruction with a modern light/dark interface and a much wider set of metrics. A new Dashboard gives you live summary cards and a rolling throughput chart; Protocols add an IPv4 / IPv6 toggle; Interfaces, Connections, Probes and History are all new; and Alerts can now reach you by desktop notification, email, webhook (Slack / Teams) or Pushover.
Changelog — what's new in each release
Full release history from the original v1.0 to the all-new 2.0.0, with the new Dashboard, IPv4/IPv6 protocol charts, interfaces, connections, probes, history and multi-channel alerts.
View the full changelogUser Guide — every section explained
A plain-English walkthrough of Dashboard, Protocols, Interfaces, Connections, Probes, History, Alerts and Settings — plus setting up email / webhook / Pushover delivery and using the system tray.
Read the User GuideFeatures
📊 Dashboard Overview
Live summary cards for current download and upload speed, active TCP connections, total connections and the busiest adapter — with a rolling total-throughput chart and the latest alert status, all on one screen.
📈 Protocol Charts
Four live charts for TCP, UDP, IP and ICMP — connections, packets per second, errors and echo counts. Flip the IPv4 / IPv6 toggle to switch the TCP/UDP/IP charts; each keeps the last 60 seconds on screen.
🧩 Per-Adapter Interfaces
A sortable table of your network adapters with live in / out / total Kbps, utilization %, link speed, IP address, MAC address and MTU — each row with its own trend sparkline. Loopback, tunnel and hidden adapters are filtered out automatically.
🔗 Connections by Process
Every active TCP/UDP connection (IPv4 + IPv6) in real time, mapped to the process that owns it — with PID, protocol, local and remote address and state. Filter by text and hide listeners to focus on live traffic.
📡 Probes — Ping, DNS, Traceroute
Test connection quality to any host: continuous ping with current / average / min / max latency, jitter and packet-loss on a live chart, plus DNS resolution timing and a full traceroute with per-hop round-trip times.
🕘 History & Trends
NetPulse saves network activity locally so you can look back over the last 15 minutes, hour, 24 hours or 7 days. Pick a range to see download/upload trends across that period; history is kept for 7 days.
🔔 Threshold Alerts
Set rules on any tracked metric — choose a metric, a > or < comparison and a threshold. Rules can be toggled, edited or removed, a recent-alerts feed shows what fired, and each rule has a built-in cooldown so you're not spammed.
✉️ Multi-Channel Delivery
Get alerts where you'll see them: desktop notifications, email (with selectable SMTP / SMTPS / STARTTLS / custom port), webhook for Slack or Microsoft Teams, and Pushover. A per-channel Test action confirms delivery before you rely on it.
🖥️ Runs Quietly in the Tray
Minimize or close to the system tray and NetPulse keeps monitoring — double-click to restore, right-click for Open / About / Exit. Alert notifications still appear while it's tucked away in the tray.
🌓 Modern Light / Dark UI
A clean interface that follows the Windows theme, and runs the same on a desktop PC or on Windows Server over Remote Desktop. It only ever monitors the machine it's running on — everything stays local.
Screenshots
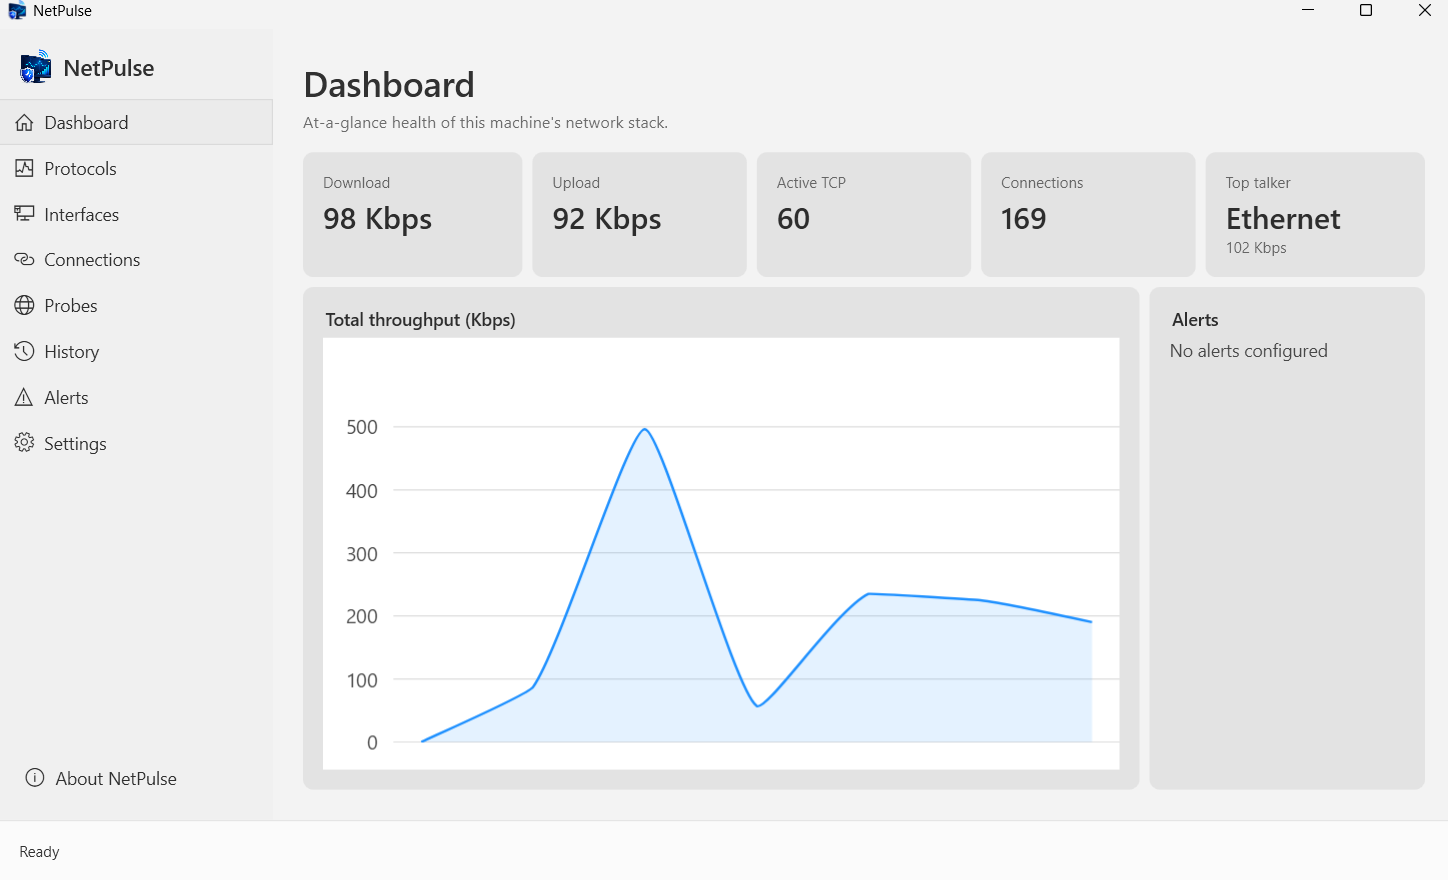
Dashboard & live throughput
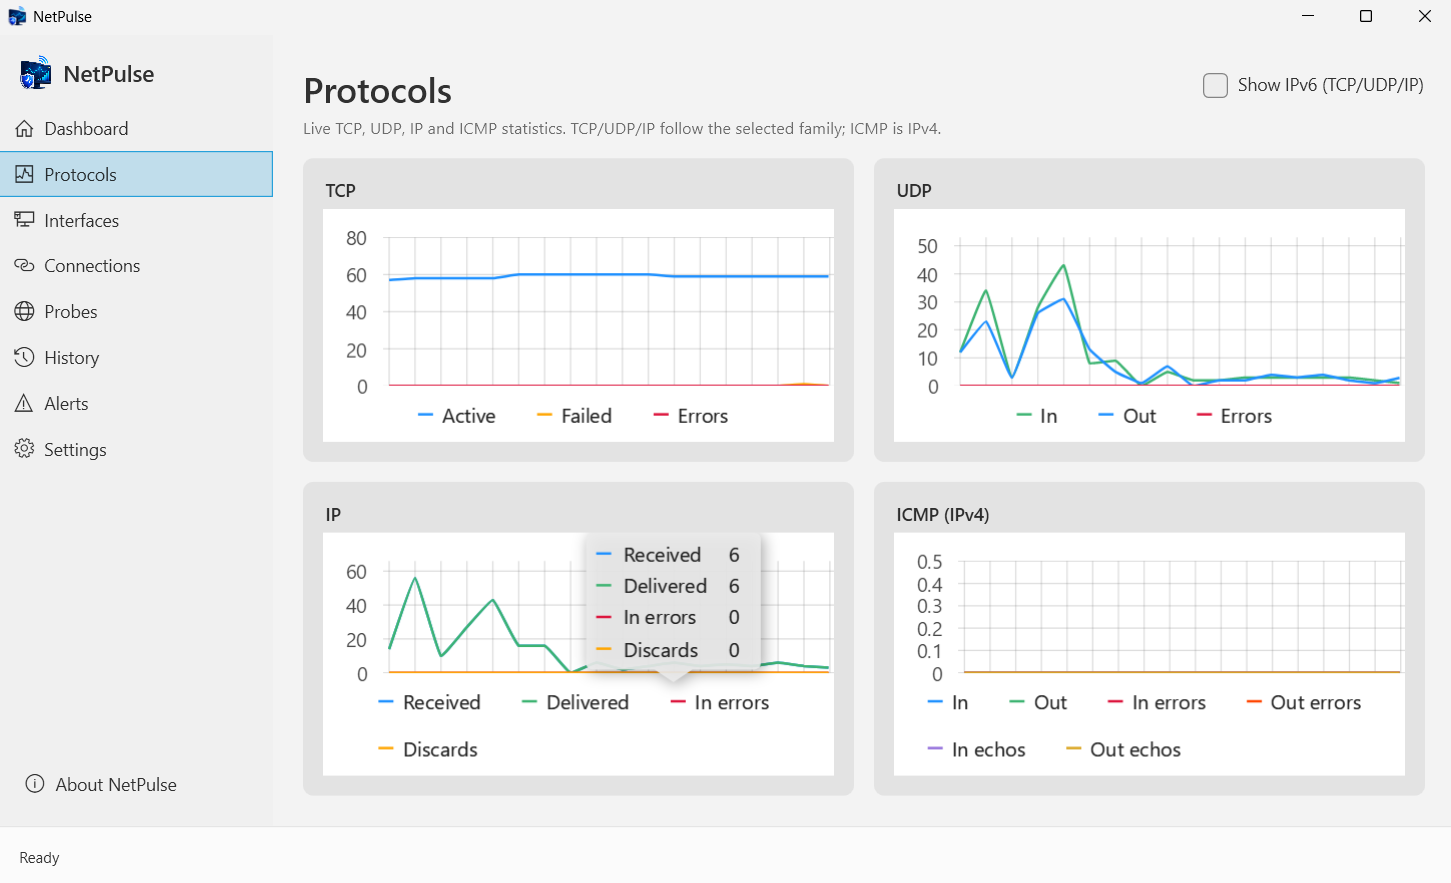
Protocol charts (IPv4 / IPv6)
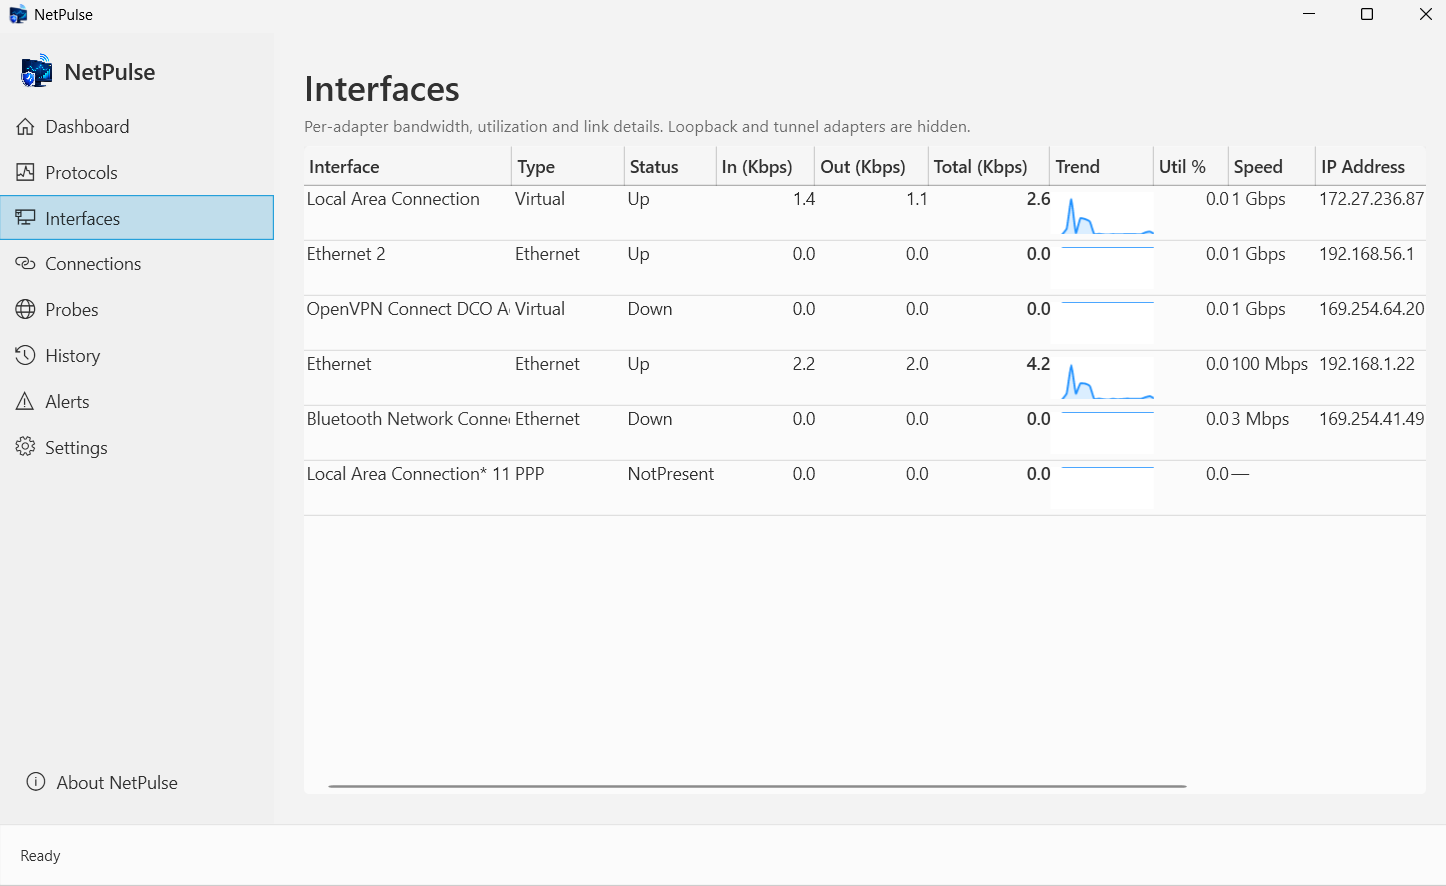
Interfaces — per-adapter bandwidth
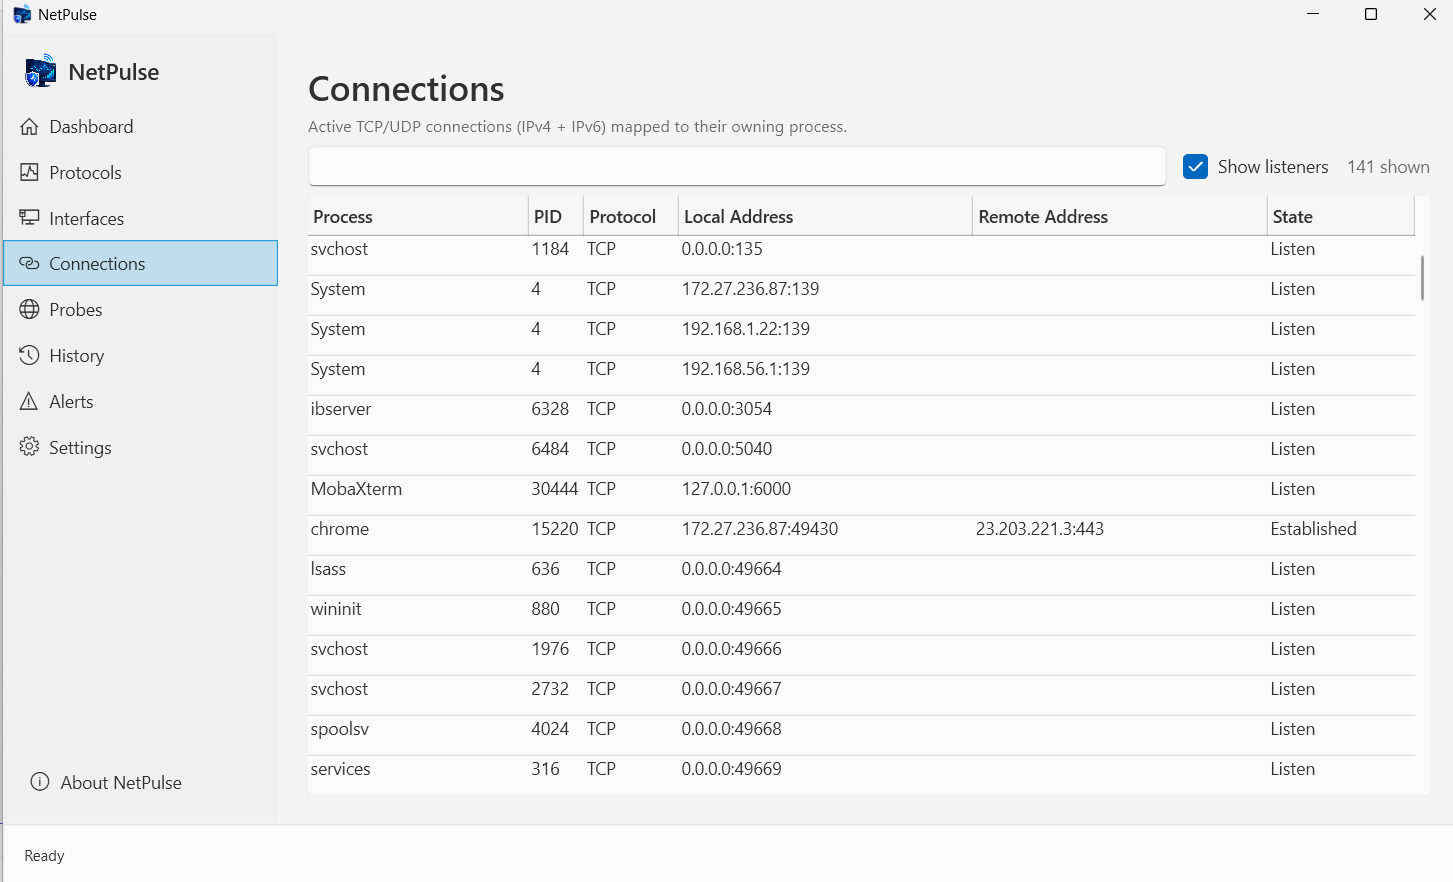
Connections by process
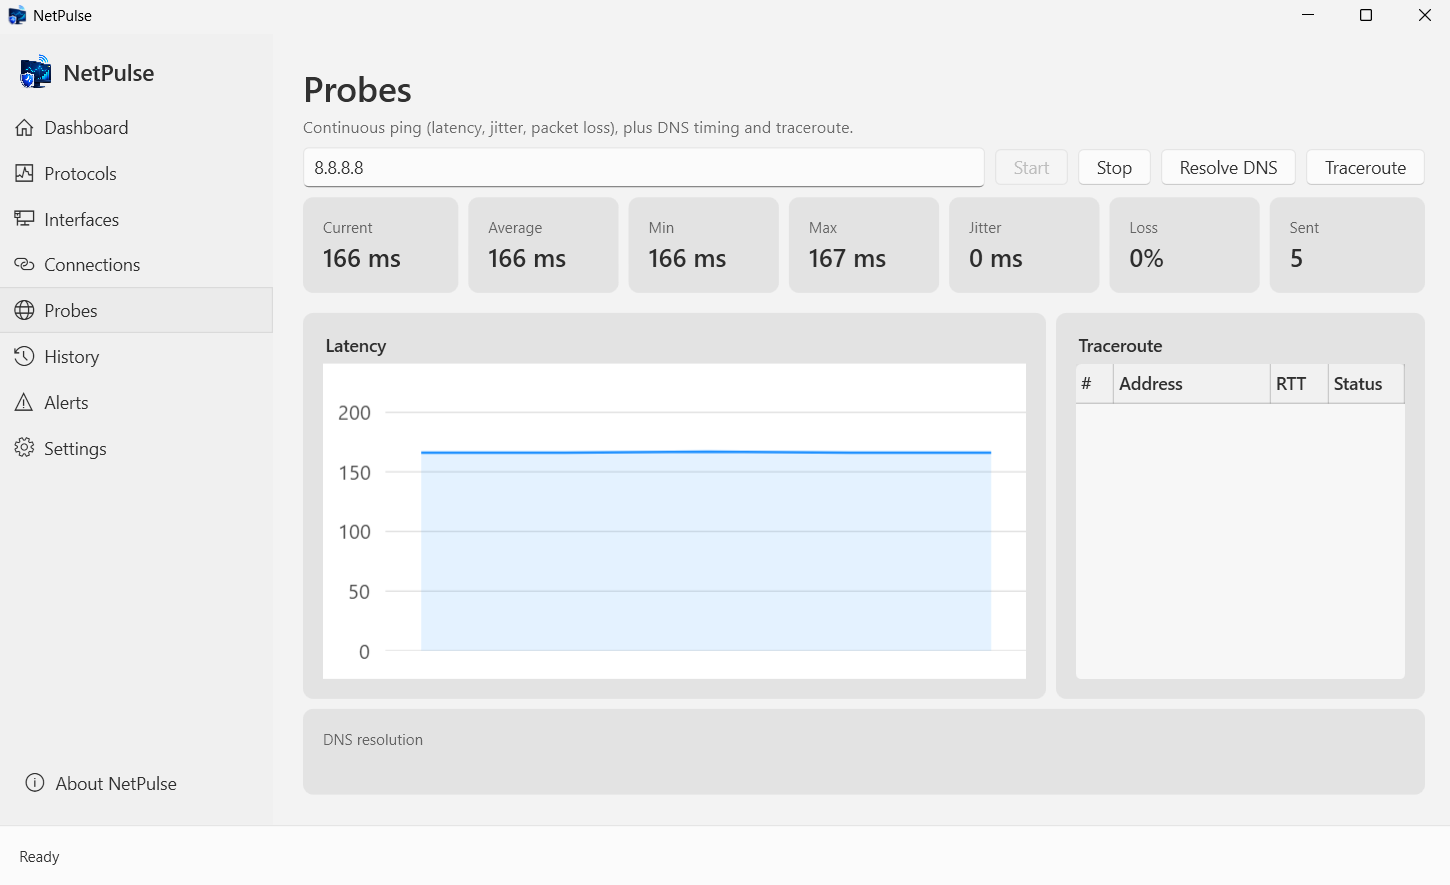
Probes — ping, DNS, traceroute
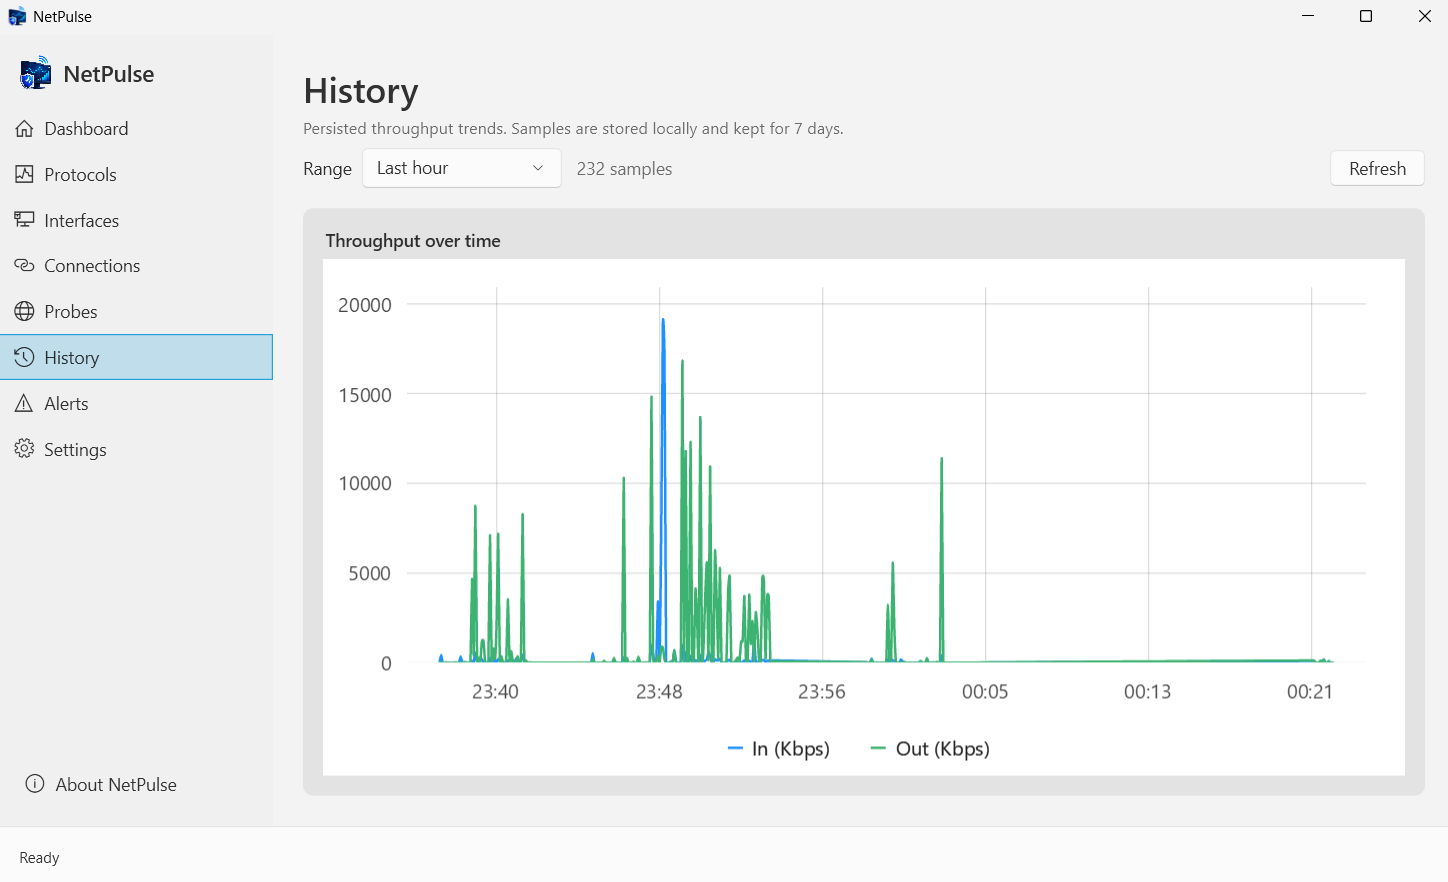
History — saved trends
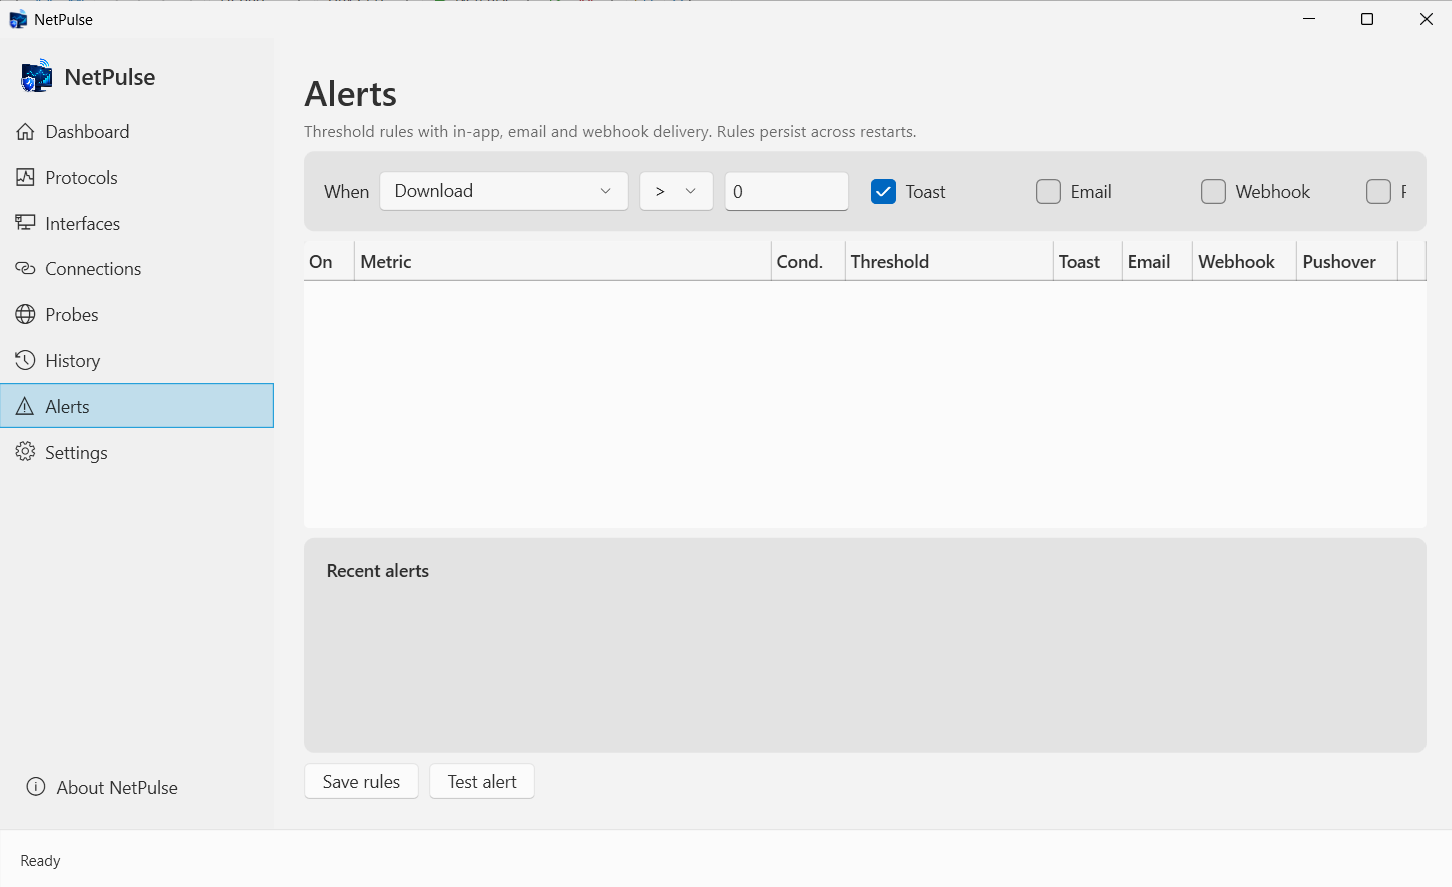
Alerts — threshold rules
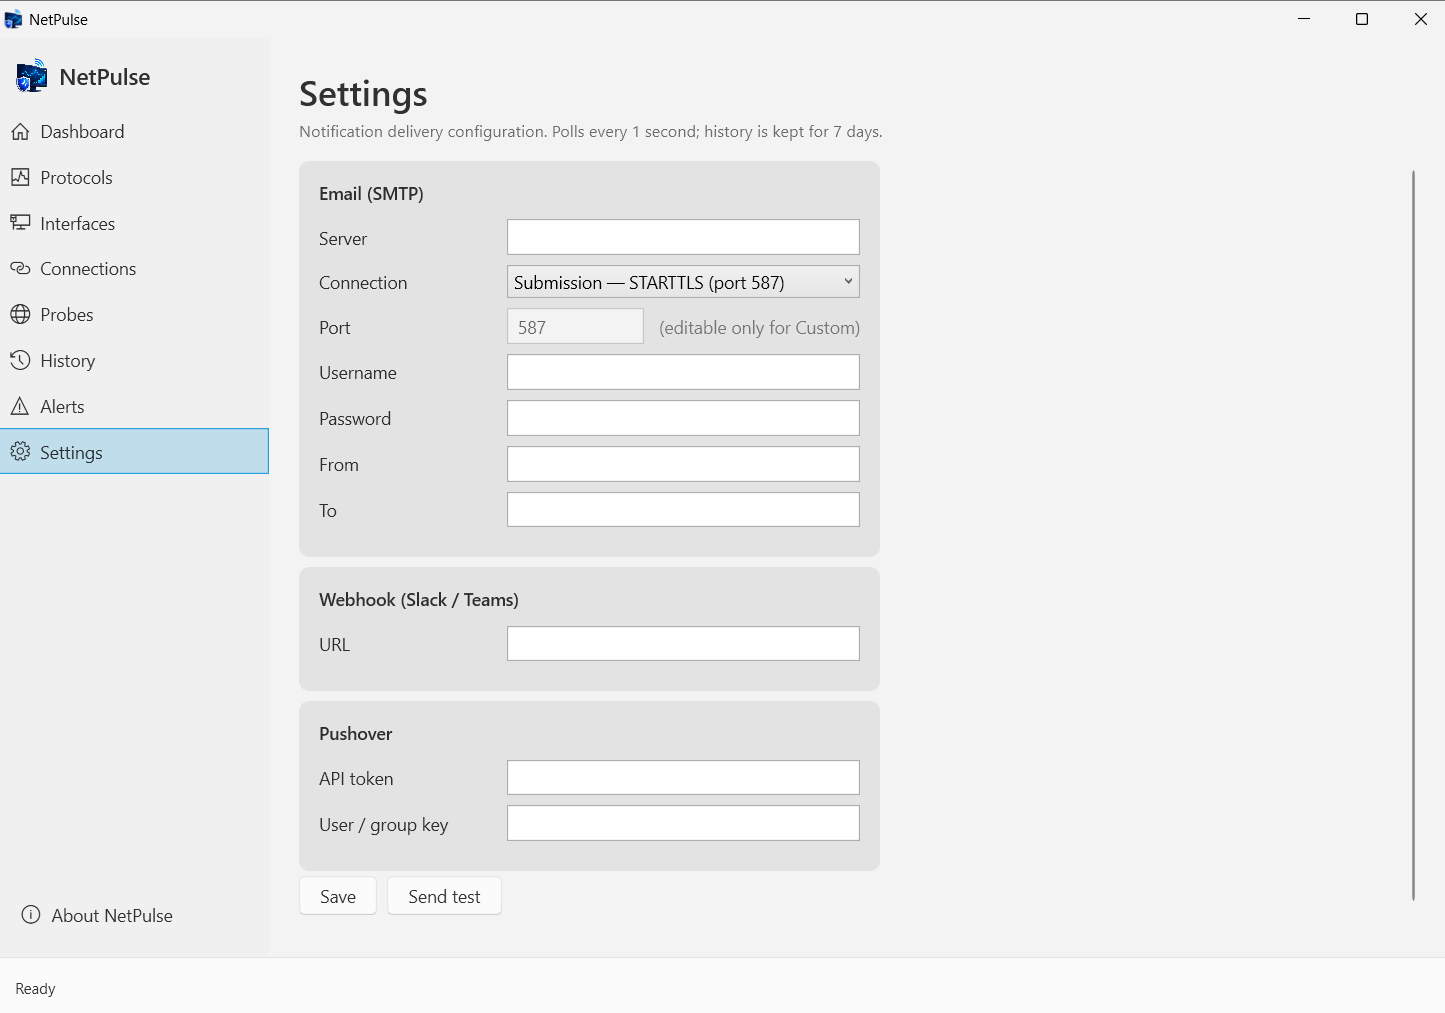
Settings — email / webhook / Pushover
Latest Release
Version 2.1.0 — September 1, 2026
Right-click actions on any connection — resolve its host name, copy it, filter by its process, or end that process after a confirmation. CSV export for connections and CSV or PNG for history. Start with Windows and start minimised to the tray. A configurable poll interval and history retention, replacing the fixed one second and seven days. Alert rules that watch a single adapter rather than the machine-wide total. Plus a dark-mode pass that fixed light panels and invisible chart labels, a connections grid that no longer resets your scroll and selection every couple of seconds, and utilization that no longer reports 200% on a saturated link.