BackendSide sFlow Collector & Analyzer
Enterprise-Grade Network Traffic Analysis for Windows. Transform your network visibility with our professional, high-performance monitoring solution that turns raw sFlow v5 data into actionable intelligence. Version 1.0 is now available for download, offering comprehensive network analytics for IT professionals, network engineers, and security analysts.
Download Desktop Version 3.0

Key Features
- 📊 Advanced Traffic Analytics: Multi-dimensional traffic analysis with top talkers, protocol distribution (TCP/UDP/ICMP), conversation pairs, application port mapping, and VLAN-aware monitoring across configurable time windows (5m, 15m, 1h, 1d)
- 🛡️ Layer 2 Security Dashboard: Full ARP monitoring suite — spoofing detection, MAC flapping alerts, duplicate IP detection, scan detection, vendor fingerprinting, broadcast analysis, retry pattern analysis, and full host history
- 🚨 DDoS & Anomaly Detection: Real-time attack detection including SYN floods, UDP amplification, ICMP storms, bandwidth anomaly alerts, and port scan identification with configurable detection thresholds
- 📈 Professional Visualization: 30+ pre-built interactive charts and tables — Chart.js-powered with drill-down capabilities, dual Y-axis charts, time-series graphs, heatmaps, and traffic matrix views
- 🏗️ VLAN Intelligence: Per-VLAN traffic summary, inter-VLAN traffic matrix, 802.1p QoS/priority analysis, and time-based VLAN heatmaps for capacity planning
- 🔌 Interface Analytics: Top interfaces by volume, utilization percentage with visual progress bars, VM/virtual interface traffic separation
- ⚡ Enterprise Performance: Lightweight collector handling multiple sFlow agents simultaneously, per-agent isolated SQLite databases, multi-threaded processing with minimal CPU/memory footprint (<50 MB RAM, <5% CPU)
- 🔒 Security & Compliance: Role-ready architecture, audit-ready logging, CSP-compliant web interface, complete on-premises data control — no cloud, no telemetry
- ⚙️ Flexible Server Configuration: Configurable sFlow collection IP and port (default 6343), built-in web server with selectable IP/port binding, optional SSL with self-signed certificate generation, live restart without data loss
- 🌐 Browser-Based Interface: No separate client software needed — full analytics accessible from any browser on your network, with session-based authentication and light/dark theme support
Feature Deep Dive
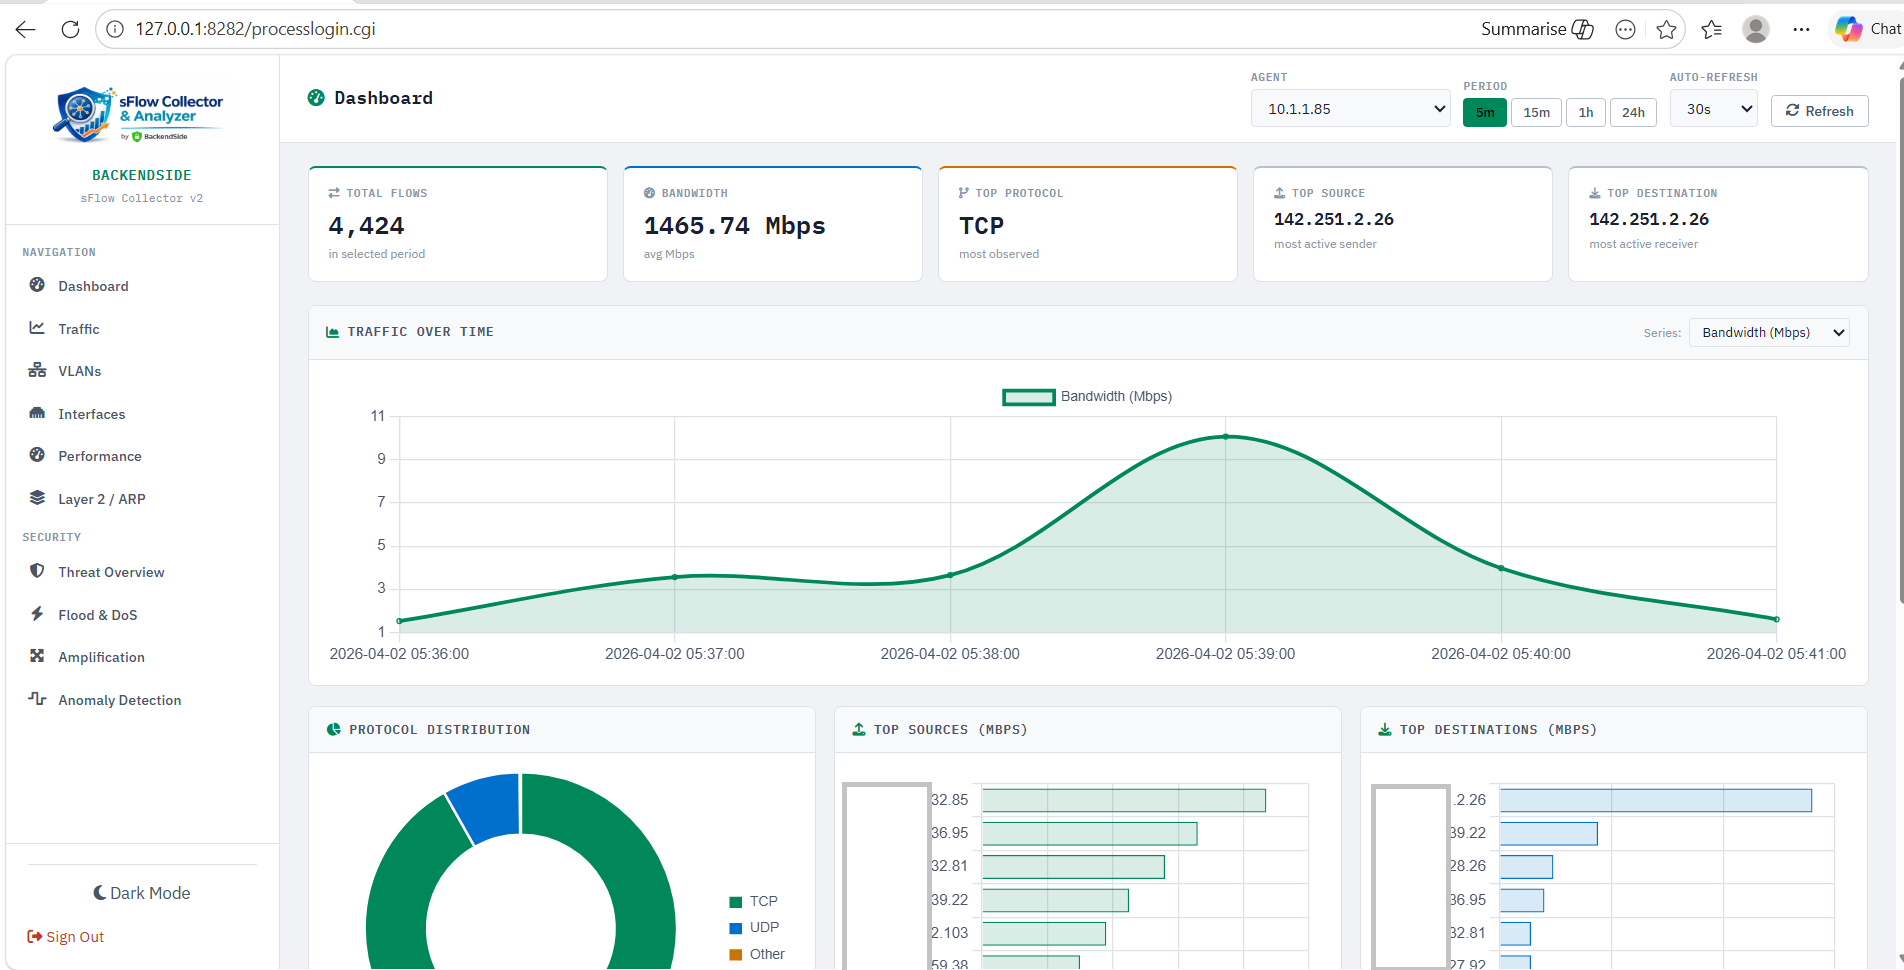
The main dashboard delivers an instant snapshot of your network health with five real-time summary cards and five live charts — all updating automatically as new sFlow data arrives.
- Total Flows — aggregate flow count for the selected time window
- Total Bandwidth — combined bytes transferred across all monitored interfaces
- Top Protocol — dominant protocol (TCP/UDP/ICMP/other) by volume
- Top Source — most active source IP address
- Top Destination — most active destination IP address
Charts include traffic over time, top sources, top destinations, protocol distribution, and top talker pairs — giving you an at-a-glance network picture before drilling into detail pages.
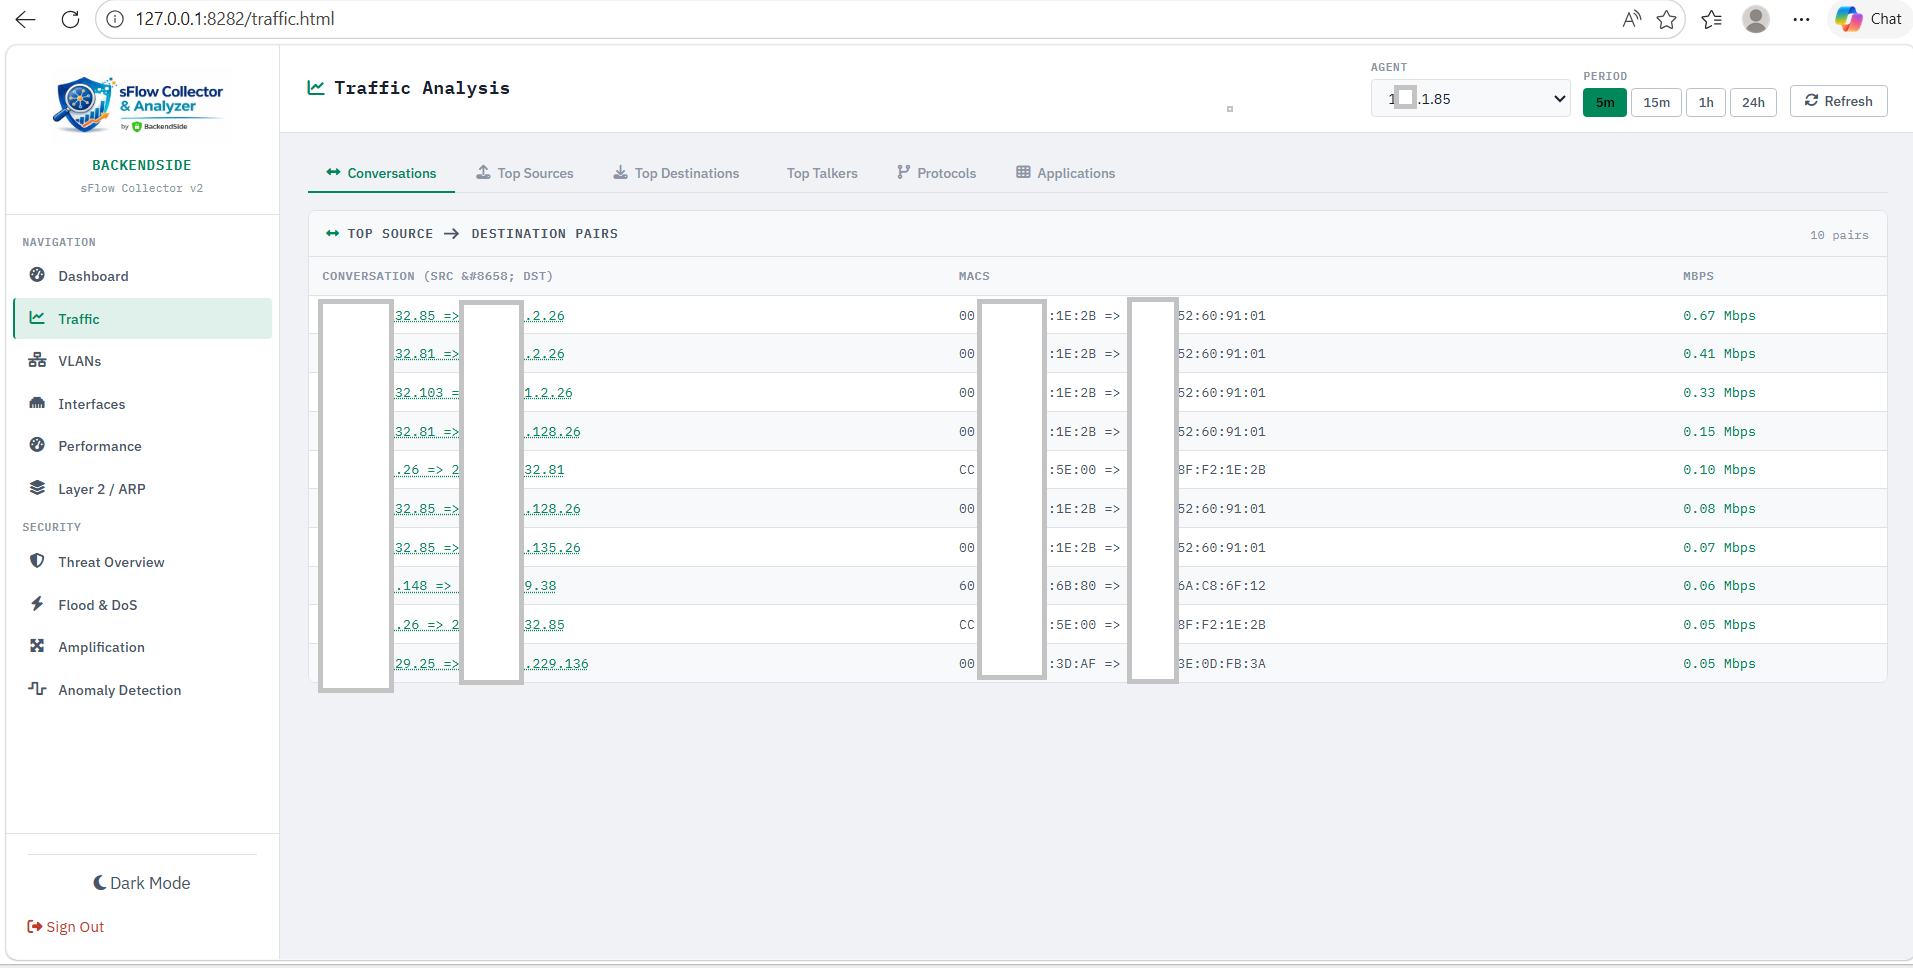
Six dedicated traffic views provide layered analysis from high-level trends down to individual conversation pairs:
- Conversations — ranked source↔destination pairs with byte counts, packet counts, and protocol breakdown; click any pair for flow-level detail
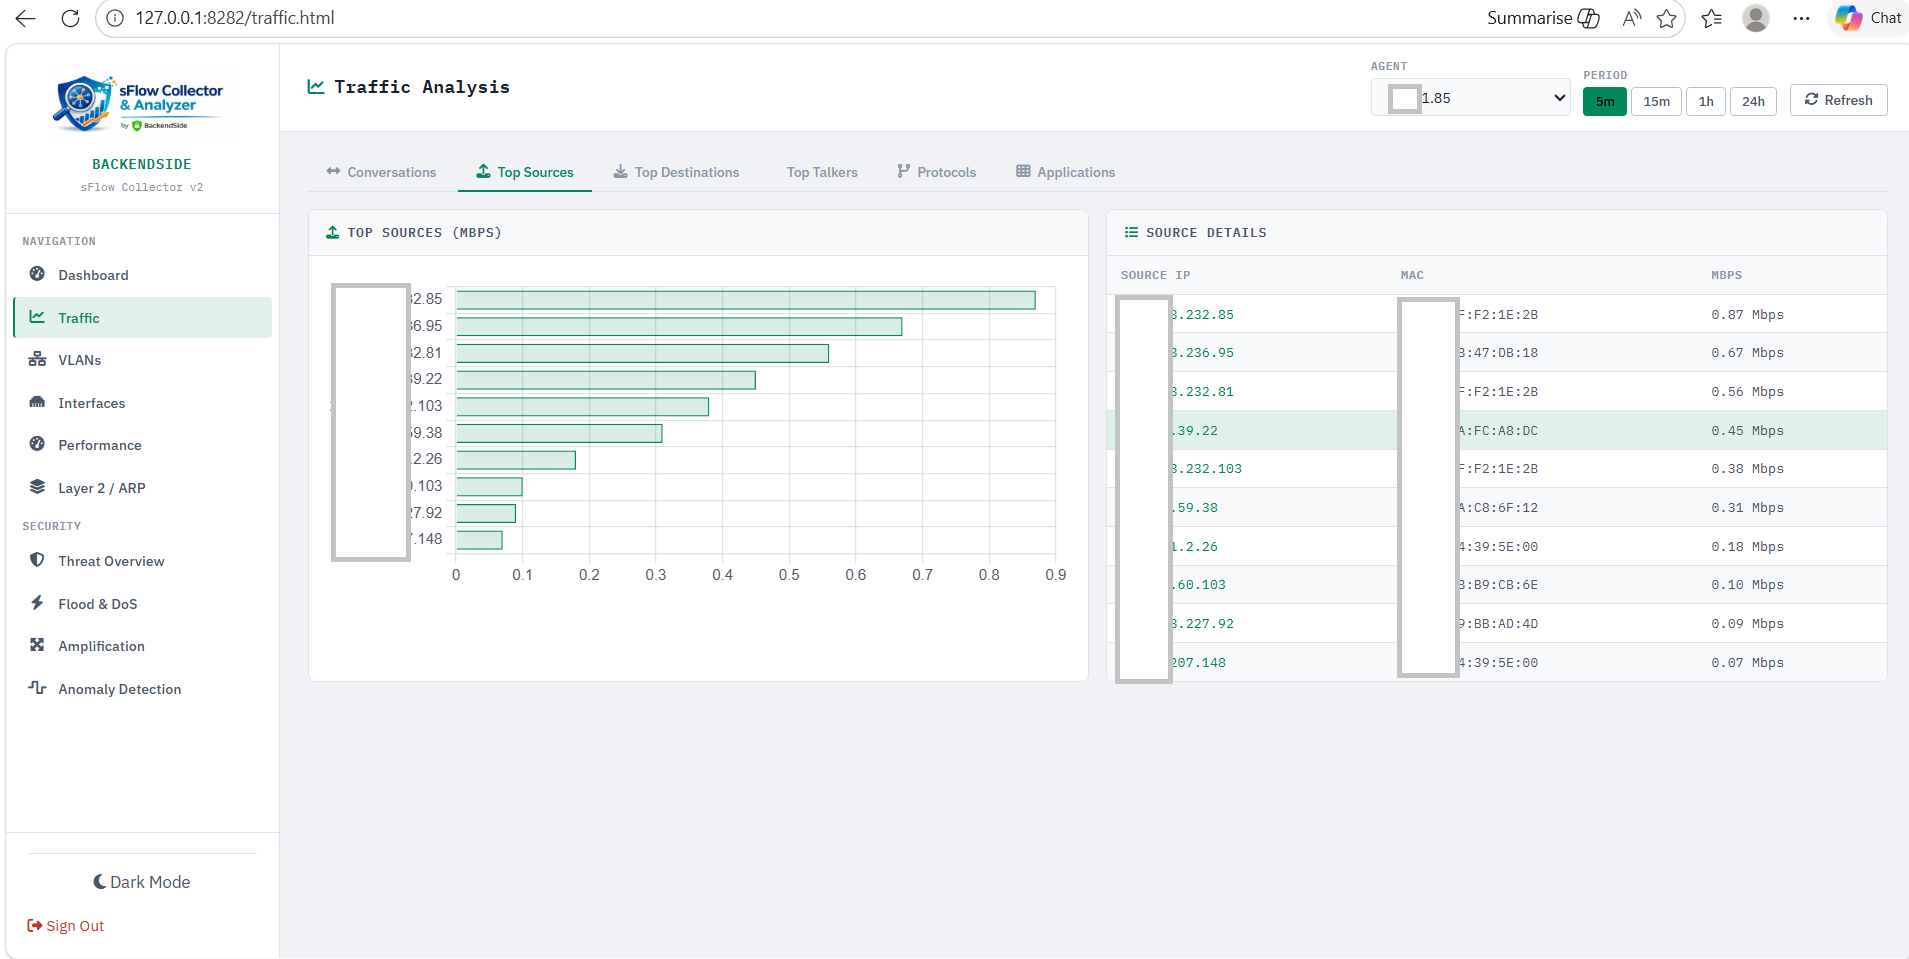
- Top Sources — ranked source IPs by traffic volume with drill-down to per-source destination breakdown
- Top Destinations — ranked destination IPs with drill-down to per-destination source breakdown
- Top Talkers — combined bidirectional view of the highest-volume endpoints on your network
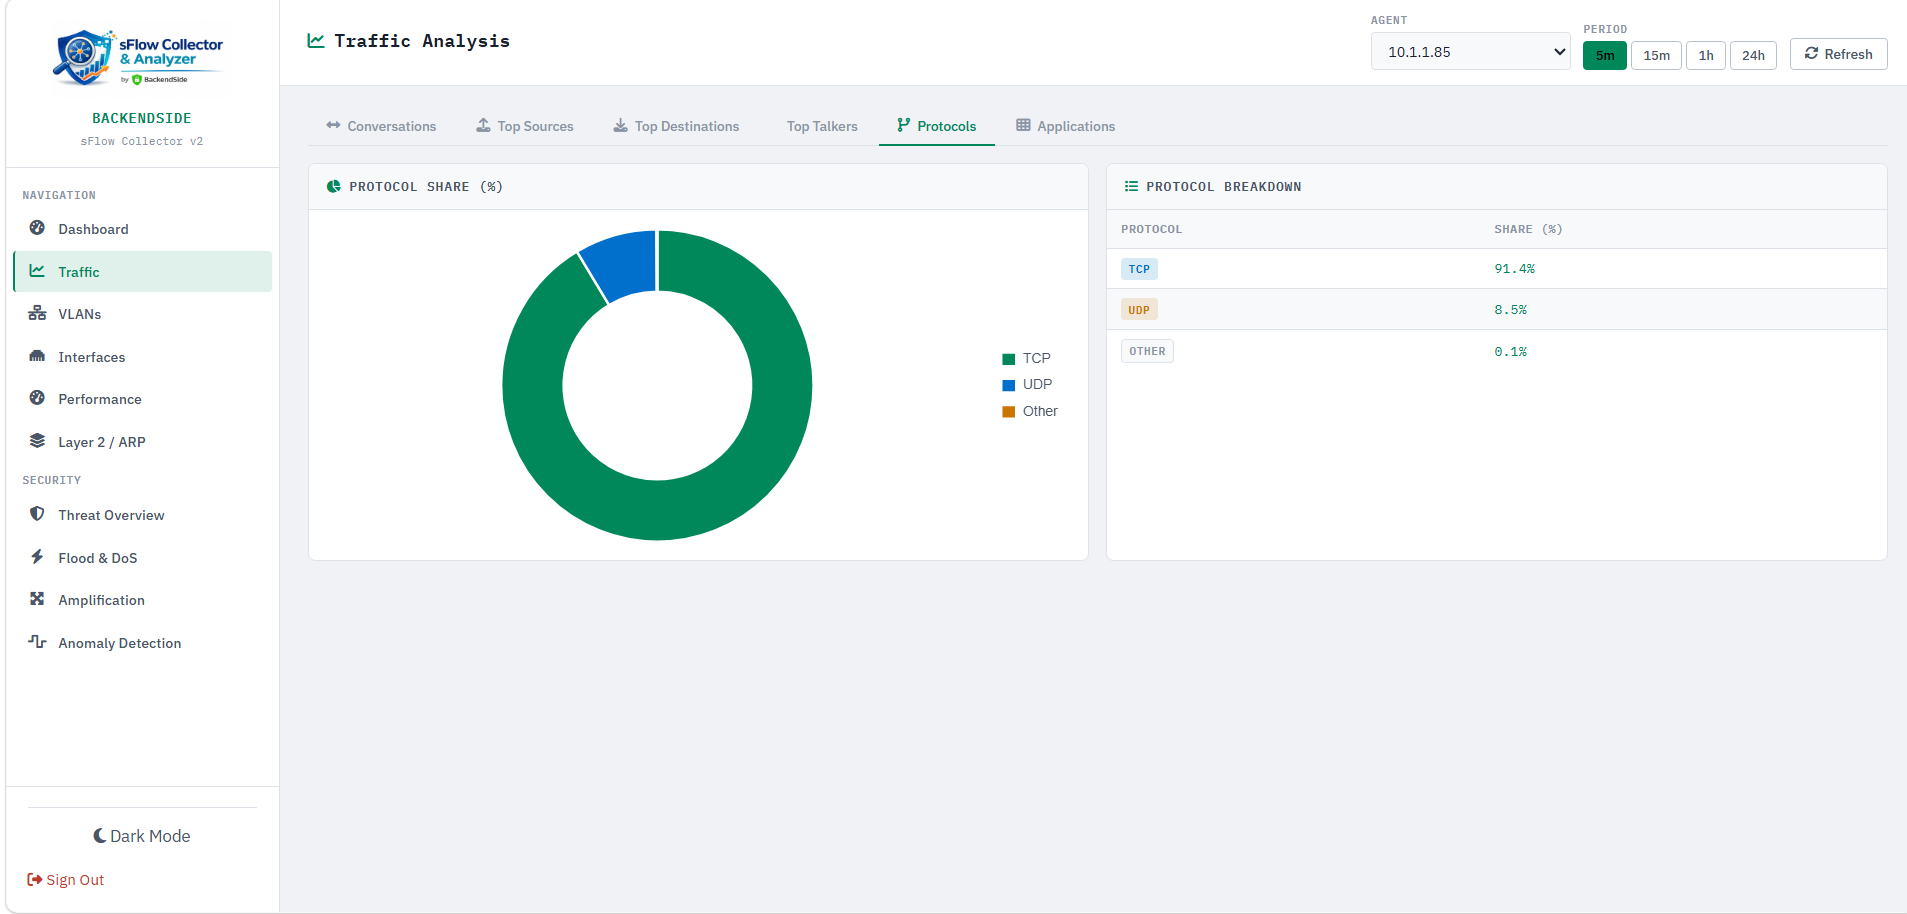
- Protocols — pie and bar charts showing TCP vs UDP vs ICMP vs other protocol distribution over time
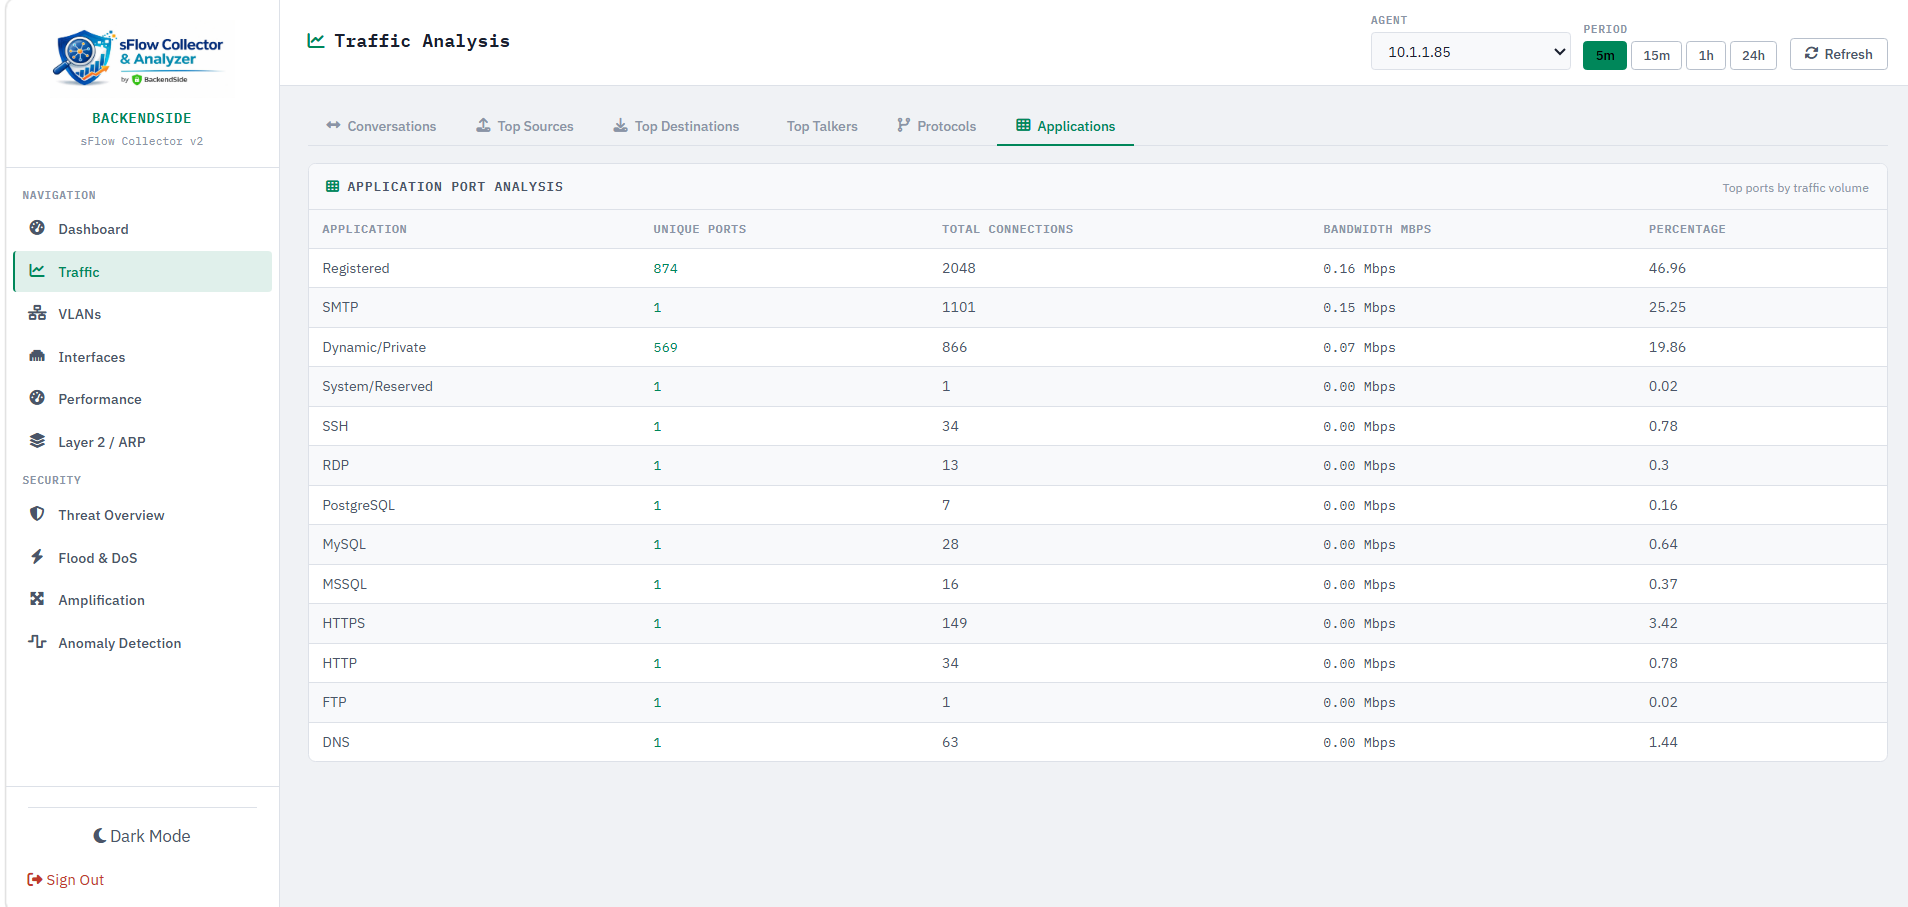
- Applications / Ports — port-based application identification mapping common ports (HTTP, HTTPS, DNS, SMTP, RDP, SMB, etc.) to traffic volumes
All views support four time windows (5m, 15m, 1h, 1d) and are selectable per sFlow agent from the dropdown.
Comprehensive VLAN-aware analytics to understand segmentation behaviour and inter-VLAN routing loads:
- VLAN Summary — per-VLAN traffic table showing bytes, packets, flow count, and top hosts for each VLAN ID
- Inter-VLAN Matrix — heatmap matrix showing traffic flows between every VLAN pair, immediately highlighting unexpected cross-VLAN communication
- Priority / QoS — 802.1p priority bit distribution showing how your network uses CoS markings (voice, video, data, control plane traffic separation)
- VLAN Heatmap — time-of-day × VLAN activity heatmap to identify peak usage patterns per VLAN for capacity planning
- Top Interfaces — ranked list of physical and logical interfaces by total bytes, packets, and flow count so you can instantly identify congested ports
- Utilization — percentage utilization per interface with visual progress bars colour-coded green/amber/red, based on observed sFlow rates vs configured interface speed
- VM Traffic — virtual machine / hypervisor interface traffic separated from physical interfaces, useful in VMware/Hyper-V environments that export sFlow from vSwitches
Real-time threat detection built directly into the sFlow pipeline — no separate IDS sensor required:
- Port Scan Detection — identifies hosts contacting an abnormally high number of distinct destination ports within the time window. Detection threshold is configurable so you can tune sensitivity for your environment. Results show scanner IP, port count, targeted hosts, and first/last seen timestamps.
- SYN Flood Detection — monitors TCP SYN-to-SYN-ACK ratios to flag potential SYN flood attacks. Shows attacker IPs, target IPs, SYN packet rates, and severity scoring so your team can prioritise response.
- Baseline Deviation — compares current traffic rates against a computed historical baseline to surface unusual spikes or drops. Highlights anomalous sources/destinations and the percentage deviation from normal, enabling fast identification of DDoS ingress or application failures.
- Sequence Gaps — analyses sFlow sequence numbers from each agent to detect gaps caused by packet loss, agent overload, or collector network issues. Helps ensure the integrity of your sFlow data pipeline.
The most comprehensive Layer 2 analytics suite of any sFlow collector — ten dedicated ARP and MAC analysis views:
- ARP Summary — total ARP request/reply counts, unique MACs, and top ARP-talking hosts
- ARP Top Talkers — ranked hosts by ARP volume to identify misconfigured devices or scanners generating excessive ARP traffic
- ARP Scan Detection — identifies hosts performing ARP sweeps (probing many IP addresses), a common pre-attack reconnaissance technique
- ARP Spoof Detection — detects MAC address conflicts where multiple MACs claim the same IP, or the same MAC claims multiple IPs — classic ARP poisoning indicators
- ARP Over Time — time-series chart of ARP request/reply volume to spot floods or unusual bursts
- VLAN Distribution — ARP traffic broken down by VLAN, showing which segments generate the most ARP overhead
- New MAC Detection — logs every newly-seen MAC address with first-seen timestamp and VLAN, enabling rogue device detection
- Broadcast Analysis — quantifies broadcast traffic per VLAN and per host to diagnose broadcast storms or chatty legacy devices
- Retry Patterns — detects hosts with abnormally high ARP retry rates (unanswered requests) pointing to missing hosts or blackholed traffic
- MAC Flapping — identifies MAC addresses moving between ports/VLANs frequently, indicating a loop, misconfigured bond, or MITM attack
- Duplicate IP Detection — cross-references IP↔MAC bindings to flag IP conflicts on the network
- Host History — full timeline of IP↔MAC binding changes for a given host, invaluable for forensic investigation
- Vendor Distribution — OUI-based vendor lookup showing the hardware manufacturer mix on your network (Cisco, Dell, VMware, Apple, etc.)
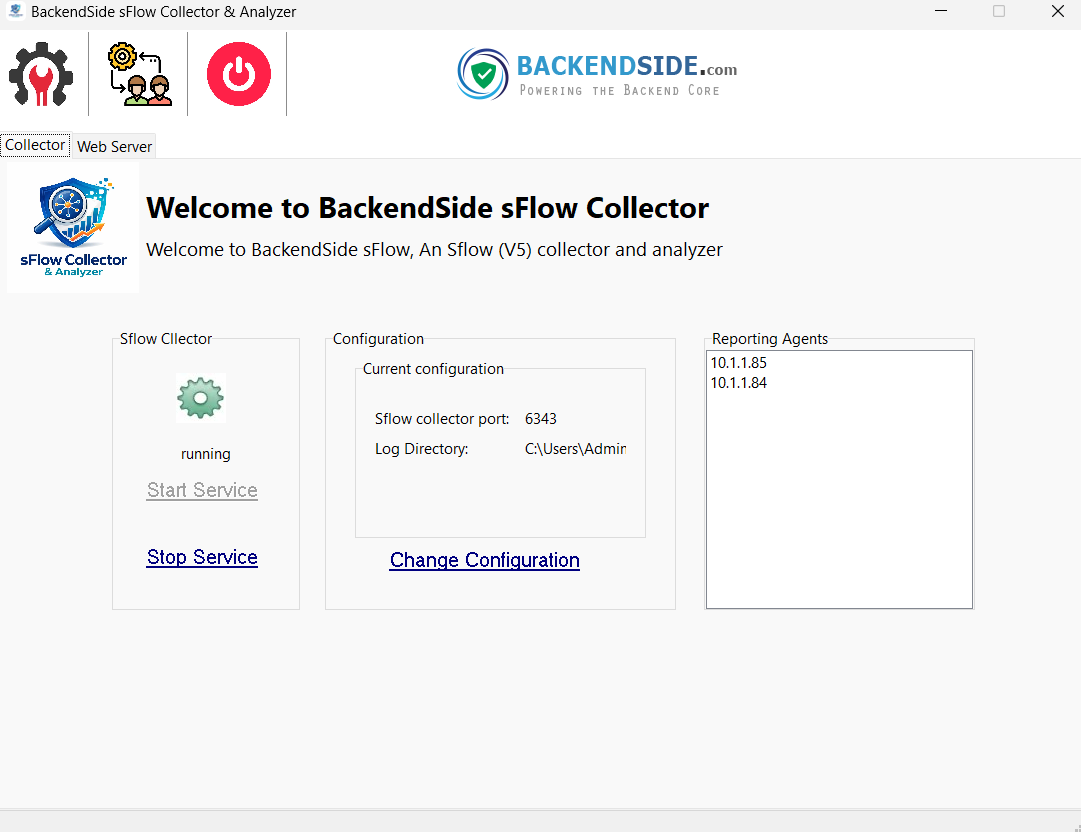
BackendSide sFlow Collector automatically discovers and tracks every sFlow-sending device (agent) that contacts it. Each agent is stored in its own isolated SQLite database, preventing data mixing and enabling independent retention policies.
- Unlimited agents — all sending to the same collection IP:port
- Per-agent dropdown selector on every analytics page
- Per-agent database stored in AppData — easy to backup or archive individual agents
- 8-hour rolling data retention per agent (configurable in future releases)
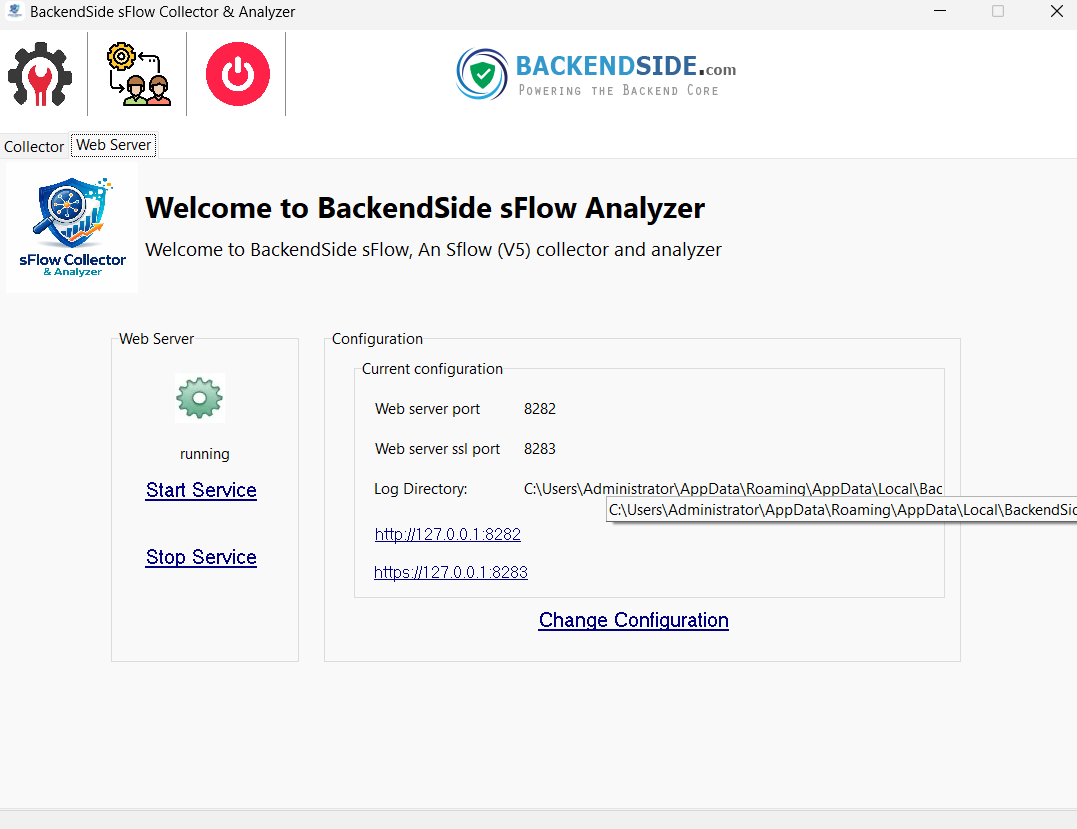
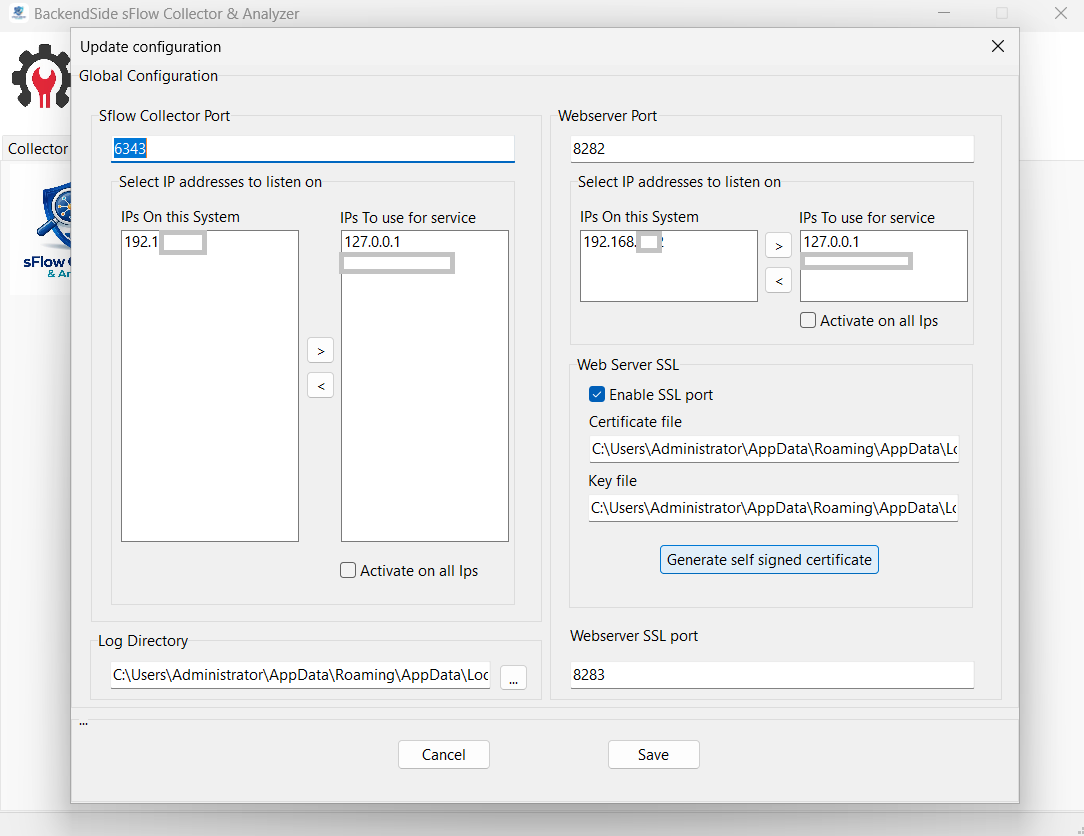
Full control over how the collector and web server bind to your network from within the application — no config file editing required:
- sFlow Collection — choose which local IP the UDP listener binds to (all available system IPs are listed), set the collection port (default 6343)
- Web Server — choose IP binding and port for the built-in HTTP server; supports binding to a specific interface or all interfaces
- SSL / HTTPS — toggle SSL on/off with a single click; generate a self-signed certificate directly from the settings page with no external tools needed
- Live Restart — apply new IP/port/SSL settings via the in-app restart button — the collector resumes immediately on the new configuration
🎯 Perfect For
- Network Administrators – Capacity planning, performance optimisation, troubleshooting
- Security Analysts – Threat detection, incident response, forensic investigation
- IT Managers – Network visibility, compliance reporting, resource allocation
- MSPs & Consultants – Multi-tenant ready for client deployments
- Educational Institutions – Teach networking concepts with real data
🌟 Why Choose BackendSide?
- Complete solution – Not just a collector, but a full analytics platform
- Enterprise features – Layer 2 security, DDoS detection, forensic tools
- Professional interface – Clean, intuitive, and responsive dark/light theme
- Active development – Regular updates based on user feedback
- No subscriptions – One-time purchase, lifetime use
- No cloud dependency – All data stays on your Windows machine
✅ Compatible sFlow Devices
Any device that exports sFlow v5 will work with BackendSide sFlow Collector. Tested and compatible with:
- Cisco Catalyst & Nexus
- Juniper EX / QFX / SRX
- Arista EOS switches
- Dell EMC networking
- HP / HPE ProCurve & Aruba
- Extreme Networks
- VMware vSphere vSwitch
- Open vSwitch (OVS)
- Any sFlow v5-compliant device
Software Screenshots
Main Dashboard - Real-Time Network Overview
Advanced Traffic Analytics with Protocol Distribution
Layer 2 Security Dashboard - ARP Monitoring
DDoS & Anomaly Detection Alerts
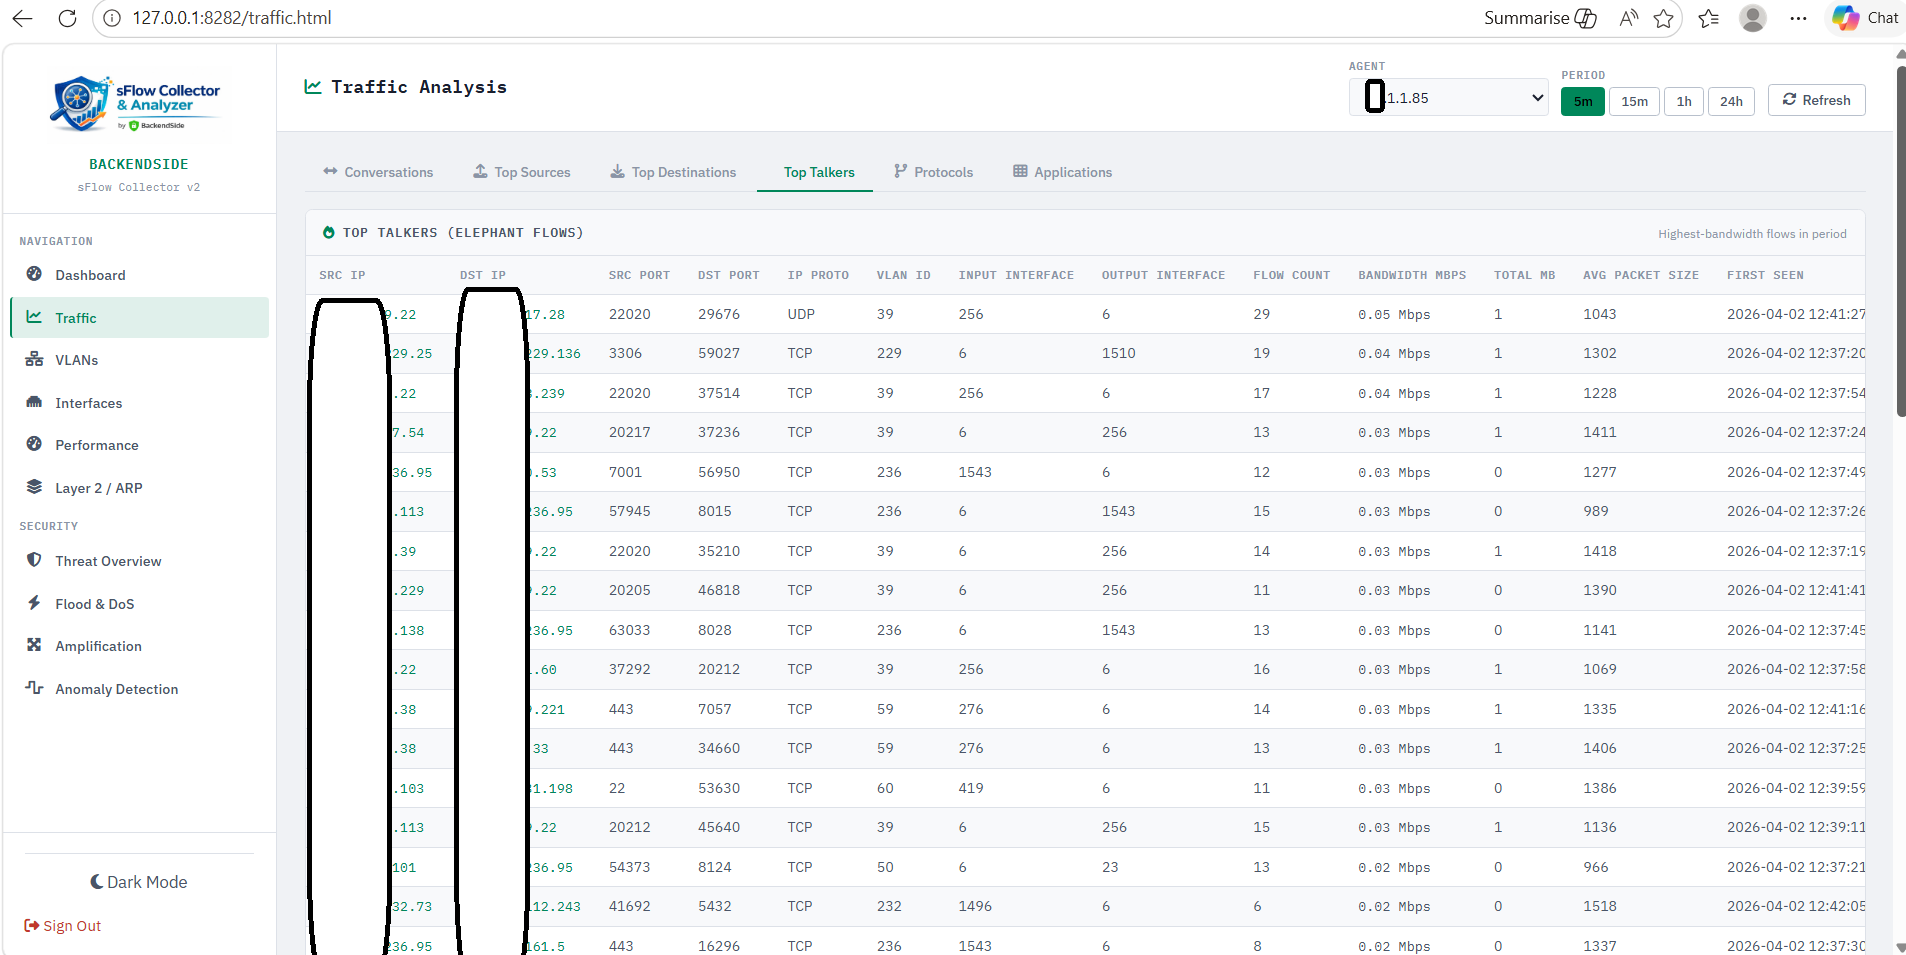
Top Talkers & Bandwidth Analysis
VLAN-Aware Monitoring with Inter-VLAN Matrix
MAC Address Tracking & Vendor Analysis
Port Scan & Reconnaissance Detection
Historical Trends with 8-Hour Rolling Retention
Multi-Agent Management Console
Latest Release
Version 3.0 — April 2026
Initial release — sFlow v5 analysis, 30+ charts, DDoS detection, VLAN & MAC tracking, fully on-premises.